We’ve raised $16M for Luma Health’s B Round

I’m not sure I even wrote on my personal blog when we raised our A round — but here we are, about four and a half years after we founded the company, having just announced we closed our $16M B round!

The official Luma Health funding announcement blog has a lot more interesting information about the round itself. You can check out a few of the articles that have already crossed the wire, such as this one by VentureBeat or this one by HIT Consultant. I wanted my personal blog to be more of a look behind the scenes of the three parts that came together to make today happen.

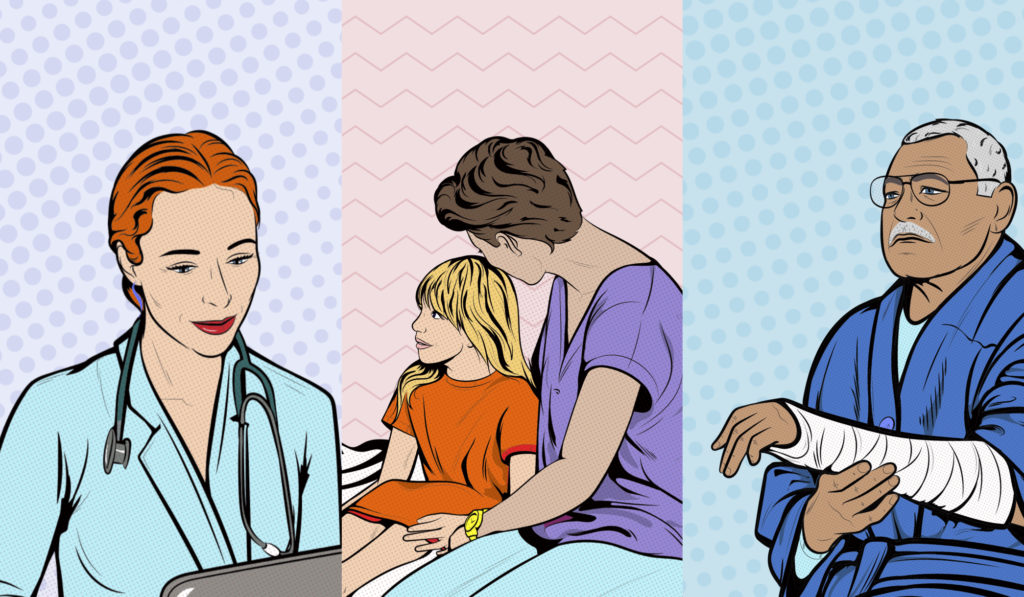
On a day like today, a company is looking to do a lot of things at once to try to make noise and drive the hype — and we were no exception. Earlier in the year, our Marketing team had kicked off an effort to do a total brand overhaul, and so when we were in the process of closing Series B funding, we decided to line up the efforts of the B announcement with the brand refresh (full details on the Luma brand design blog post), and launch them at the same time so we have that the ideal 1+1=3 punch.

Doing a brand refresh is no small feat as it has a habit to spider across all parts of the organization. You have to update sales collateral, landing pages, slide decks, event booths, social pages, etc, etc — the list goes on and on. But perhaps most importantly, a brand refresh also means you’re going to be updating your entire product to match the new brand.

At Luma, we have a centralized Design team run by our Design Director. They’re responsible for all aspects of design, be it product UX/UI, brand marketing, event collateral, etc. Right or wrong, many companies will have design functions within each functional team (e.g. product designers in the VP Product org, marketing designers in the VP Marketing org, etc), but we made a choice early on to centralized design in one team that’s shared across the company.

So, we had three trains moving at the same time — press releases and media for the B announcement, new marketing website for the brand overhaul, and a new product website refresh to match. Coordinating the Lichtenstein-esque look and feel vibe throughout all the touchpoints was the responsibility of the Design team and coordinating and driving the overall projects was the responsible of the Marketing team.

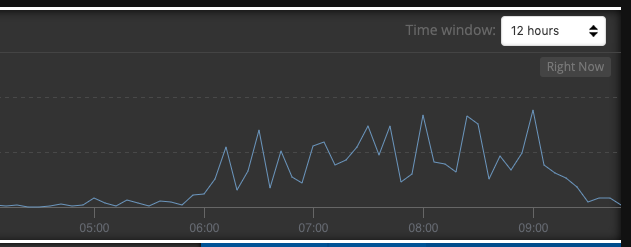
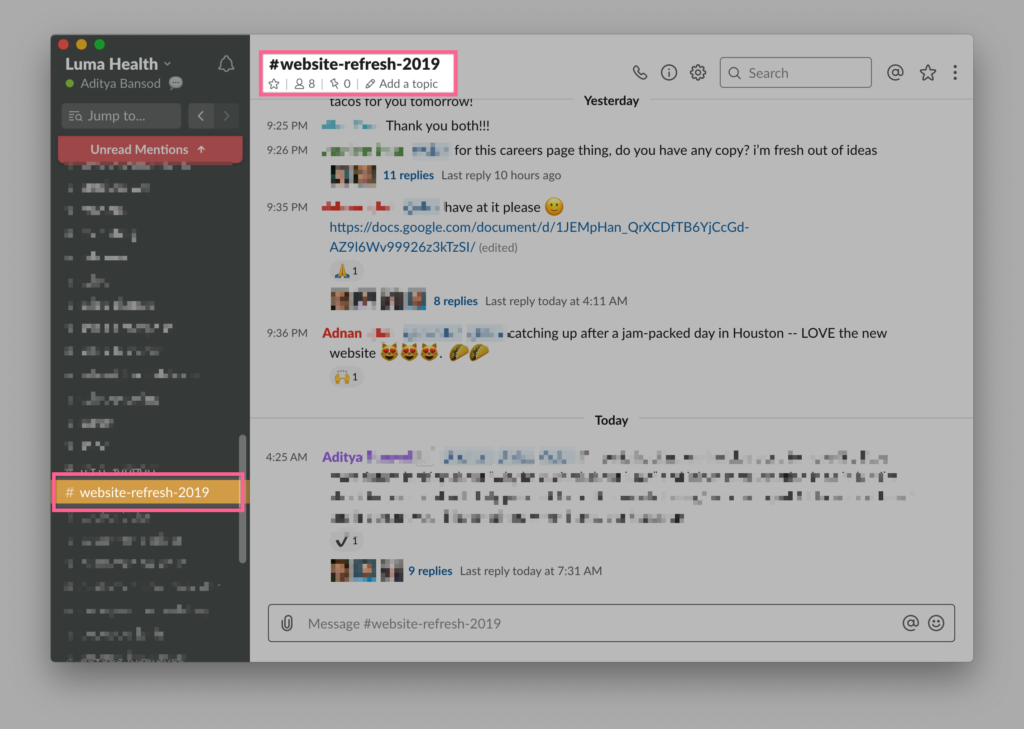
The main “hard part” doing something like this is making sure all the trains arrive when you want them to, and part of that is deciding that they don’t all need to get to the station at the same time. To coordinate all the pieces, we use (of course) used Slack. We’re a zero-email company so the entire project ran through a Slack channel called #website-refresh-2019.

We launched the product updates at Monday 8/26 4:30PM PT, launched the marketing website at Monday 8/26 5:00PM PT, and then launched the press releases and cleared the news embargo at Tuesday 8/27 5:00AM PT. And like that, new website, new brand look, new product look and feel, all in support of the future growth of Luma Health, fueled by our $16M raise.

547 Words

Unbounded Range Queries in Mongo

In Luma Health, often times we have to do queries against collections that have 50, 60, 100M+ records — as you’d expect, well thought through queries and good indexes are the building blocks to querying these types of collections.

In today’s example, we had a collections in production that contains a DATE field where we have to do range queries (e.g. DATE > something, DATE < something). We started to notice a large number of the underlying API calls that hit that table were getting logged to our slow execution monitoring. Specifically in one service, we started seeing about 500 slow logs per 5 minute interval.

We spent some time looking through the Mongo query planner, digging in to the DB queries the API calls were making and and few found a few examples like this:

    date: { $lte: endDate },
    endDate: { $gte: startDate }

Now both the date and endDate fields were in a proper compound index that the Mongo query planner was using, but when looking through the execution stats, the query planner was canonicalizing each end of the ranges as date: {$lte: endDate, $gte: Infinity }. Yikes! All the hard word in indexing, query design, etc, went out the window — when the query executed, Mongo had to pull two entire ranges and then intersect them in memory rather than through the index.

We quickly fixed the queries and as you’d expect, much happier production monitoring. In the graph below you see around 6am the daily load starts to pick up and the the slow logs pick up in frequency. We deployed the change about 915am and like magic, the slow logs go back down to zero.

Moral of the story: unbounded range queries can lead to very unintended performance consequences.

286 Words

Our First Five Hires at Luma Health

I was having a conversation with my father about how people at startups often say “I was employe X at such and such company”. It got me thinking who were our first few hires and what were their roles. So I pulled the data for our conversation and I thought I’d share it.

We use Zenefits as our HR system and it presents two views: active employees and all employees. The difference in the two views shows how startup hiring and employment is a very fluid based on the needs of the company as it scales.

All Employees

  1. Marketing, part time
  2. Account Exec
  3. Sales Director
  4. Account Exec
  5. Account Exec

You may find it unusual that we didn’t have any engineers in the first five hires. For us at Luma, our engineering at the beginning was done by me and by a friend who was working as a contractor at the beginning of the company.

Most of the original hires were various sales folks. We had just raised our seed round and the product was ready enough to start selling, so we started hiring sales people. It took us a while to figure out who we wanted and our Sales Director came on board and helped figure that out for us. Most of the hires through that period were in the sales world.

Active Employees

  1. Head of Engineering
  2. Customer Success Manager
  3. Account Exec
  4. Business Analyst
  5. Customer Success Manager

Our current active employees look pretty much what’s you’d expect at a VC backed company, but perhaps a little light on engineering. We optimized as we went for revenue generation so there are a lot more heads in the revenue roles (sales and customer success). After we raised our A round, we started hiring more heavily in engineering and also extended the engineering team pretty significantly with contractors.

305 Words

Performance Implications When Comparing Types in Node.js

Like in any language that is weakly typed, you can’t avoid the fact that performing comparisons across types will cost you CPU cycles.

Consider the following code which does a .filter on an array of 5M entries, all of which are Numbers:

let arrOfNumbers = Array(5000000).fill(1);
console.time('eqeq-number')
arrOfNumbers.filter(a => a == 1)
console.timeEnd('eqeq-number')
console.time('eqeqeq-number')
arrOfNumbers.filter(a => a === 1)
console.timeEnd('eqeqeq-number')

On my Mac, they’re roughly equivalent, with a marginal difference in the performance in the eqeq and eqeqeq case:

eqeq-number: 219.409ms
eqeqeq-number: 225.197ms

I would have assumed that the eqeqeq would have been faster given there’s no possibility of data type coercion, but it’s possible the VM knew everything was a number  in the array and the test value, so, meh, about the same.

Now, for the worst case scenario, consider this following code: the same .filter, but the array is now full of 5M strings of the value “1”:

let arrOfStrings = Array(5000000).fill('1');
console.time('eqeq-string')
arrOfStrings.filter(a => a == 1)
console.timeEnd('eqeq-string')
console.time('eqeqeq-string')
arrOfStrings.filter(a => a === 1)
console.timeEnd('eqeqeq-string')

The eqeq costs about the same as the original example with the weakly typed Number to Number comparison, but now the eqeqeq is significantly faster:

eqeq-string: 258.572ms
eqeqeq-string: 72.275ms

In this case it’s clear to see that the eqeqeq case doesn’t have to do any data coercion since the types don’t match, the evaluation is automatically false without having to muck the String to a Number. If you were to continue to mess around and have the .filters compare eqeq and eqeqeq to a String ‘1’ the results again are the same as the first few tests.

Conclusion? Same the VM work if you can. This is a really obtuse example as the eqeqeq can quickly shortcut the comparison to “false” since the types don’t match, but anywhere you can save effort when working on large data sets, it’s helpful to do so, and typing is an easy win when you can take it.

340 Words

Optimizing Array Lookups in Node.js

Following up on last week’s post, one of the areas we see (saw!) our integration service running CPU hot was when it was doing the core part of it what it does: diffing the list of data we receive from an EHR integration with our own knowledge of the data (aka a sync process). When the data set was in the 1000s of records, the diff calculations were effectively a couple of milliseconds, but as the data sets reached 10k+ records, we often saw in production that the diffs could take over 50/60+ seconds.

Our original implementation of this diff algorithm was pretty simple. It took the inbound list and did an Array filter against one list, and then an Array find on the other to see if there were matches. Here’s a snippet of the code:

const onlyInInbound = inboundList.filter(currentInbound => {
	return lumaList.filter(currentLuma => {
		return currentLuma.externalId.value == currentInbound.id;
	}).length === 0;
});

The operation was basically O(n*m). In one customer’s account, that implementation ran on average of 54,844ms to run. Not good. In synthetic tests we’d see the function run faster over time as the JIT caught up to the work but it was pathetically slow.

Our first pass at optimizing this was to use a technique similar to fast.js‘s array methods, which is to not use the built in Array functional operators and switch to more vanilla for loops. From reading a bunch, the built in iterators have to detail with things like spare arrays so you end up spending a lot of type in edge case checking. We know for sure what the input data sets look like, so we eventually moved to an implementation that looked like this:

function filter (subject, fn) {
	let result = [];
	for (var i = 0; i < subject.length; i++) {
		if (fn(subject[i])) {
			result.push(subject[i]);
		}
	}
	return result;
}

const onlyInInbound = filter(inboundList, currentInbound => {
	return filter(lumaList, currentLuma => {
		return currentLuma.externalId.value == currentInbound.id;
	}).length === 0;
});

This implementation was much much faster, and brought the operation in that same customer account down to 20,316ms on average. Not amazing by any stretch, but far faster than before.  As we kept writing synthetic tests, one of the big things we noticed was the JIT wasn’t able to fully lower these functions if the comparisons weren’t on the same data type. If the comparisons were mixed presentations of the same value (e.g.. compare ‘1’ to 1), we’d get no JIT benefit (on Node 10). Unfortunately, due to the dirty nature of the data we ingest from all the EHRs we integrate with, we have to assume a level of variable typing in our data pipeline, so the JIT could only save us so much.

The last and final implementation we made (which is what is running in production now) was to do the classic tradeoff of memory versus CPU. The final implementation iterated through both lists and converted them to objects so we could do direct lookups instead of iterations of the data. Here’s a snippit of the final implmentation:

const newInboundList = {};
for (var i = 0; i < inboundList.length; i++){
	newInboundList[inboundList[i].id] = inboundList[i];
}
const newLumaList = {};
for (var i = 0; i < lumaList.length; i++){
	newLumaList[lumaList[i].externalId.value] = lumaList[i];
}
const onlyInInbound = [];

for(const inbound in newInboundList) {
	if (!newLumaList[inbound]) {
		onlyInInbound.push(newInboundList[inbound]);
	}
}

As you can see, we trade a little bit of time to do the setup (by creating a two object based representations of the data) and then do an O(n) iteration through the list of comparison data. And viola! The final implementation went to 72.5ms, a 761x improvement over the original implementation.

609 Words

Monitoring the Node.js Event Loop with InfluxDB

One of our services (our integration engine) at Luma Health has recently been encountering odd timeouts when making outbound connections to another service it depends on. The receiving service has plenty of resources to spare, so we’ve been working through the theory that the event loop in Node might be starved before the callbacks and timers loops cycles are able to be hit.

To test this, we’ve been playing with monitoring timer performance putting the data in to InfluxDB in order to aggregate and monitor it. To do that, we simply set up a setInterval and use a high resolution timer to watch the results and write the delta of when we expected to be called versus when the interval was actually called.

const Influx = require('influx');
// snapshot the package's name
const packageName = require(process.cwd() + '/package.json').name;
const measurement = 'event_loop_interval_delay';
const fs = require('fs');
const influx = new Influx.InfluxDB(process.env.INFLUXDB);
const { exec } = require('child_process');

let serviceVersion = null;

// snap out the gitsha
exec('git rev-parse HEAD', (err, version) => {
	serviceVersion = version.toString().trim();
});

// and the docker container ID
const hostname = fs.existsSync('/etc/hostname') ?
	fs.readFileSync('/etc/hostname').toString().trim() :
	'localhost';

let startAt = process.hrtime();
const intervalDelay = 500;

// set up an interval to run every 500ms
setInterval(() => {
	const calledAt = process.hrtime(startAt);
	const nanoseconds = calledAt[0] * 1e9 + calledAt[1];
	const milliseconds = nanoseconds / 1e6;
	influx
		.writePoints([{
			measurement,
			tags: {
				service: packageName,
				serviceVersion,
				hostname
			},
			fields: {
				delayTime: (milliseconds - intervalDelay).toFixed(4)
			},
		}])
		.then(() => {})
		.catch(() => {});
	startAt = process.hrtime();
}, intervalDelay);

I thought it’d be fun to share how we’re using Influx to monitor Node internals. We’ve been monitoring the data and generally seeing Node able to keep up but there are times when the integration engine is under high load and the intervals come anywhere from 500ms to multiple seconds (!!!) late.

304 Words